
PowerShell Network Ping Monitor
So my job has me travel around to remote sites and over see setup of events that can support several hundred computer systems at three to five sites. Once the setup is complete I sit back and monitor for any kind of issues. During one of these events I was in Washington and our network kept taking all of these little hits. It would happen enough that is was not causing crashes but it would cause systems to become unstable. I would check with the network guys and there monitoring system wouldn’t alert for the short blips. This made me start having constant pings and this over time morphed into what it is today.
It is a PowerShell script that will read a config file, ping the IP, write to a log file, and write a web page to display. This follows another project I had that used Perl to do almost the same thing. However I didn’t have Perl and this is on a Windows machine versus a Linux machine.
Over time I have added a bunch to this that made it more of a tool that I could use versus a simple ping monitor. Below are the features:
- Ping multiple systems
- Check HTTP web urls
- Configure on the fly without stopping script
- Writes to a logs
- Rotates logs every day
- Display on a webpage with image change when failures occur
- Plays sound upon failure
- Writes total down time to log upon recovery
- Ability to configure some aspects of displayed icons
I have used this product for 2 years and continued to improve it. The pieces I struggled the most with was getting the total down time to function correctly. Once I got through about four different ways to do it I finally nailed it down and it works. I used a diagnostic timer and then two variables to meet requirements for the IF statements. Below is the IF statement snippet.
If ($dwn -eq “1” -and $sbak -eq “0”){
$dwntimer = [system.diagnostics.stopwatch]::StartNew()
$sbak = 1
}
If ($dwn -eq “0” -and $sbak -eq “1”){
$tOut = $dwntimer.ElapsedToString(“hh\:mm\:ss”)
$dwntimer.Stop()
Add-Content .\log\DownLog.log “*** Total Down Time: $tOut ***”
$sbak = 0
}
So $dwn is the variable for a system being up or down and $sbak is for follow on status up/down. The only down fall with this is that it tracks total down time so one cycle can be one machine then the next cycle another machine. It will write the total time for both as one time. I didn’t want to spent a long time figuring variables for each object and the timers. Plus this is a pretty simple script and I wanted to keep it short as possible.
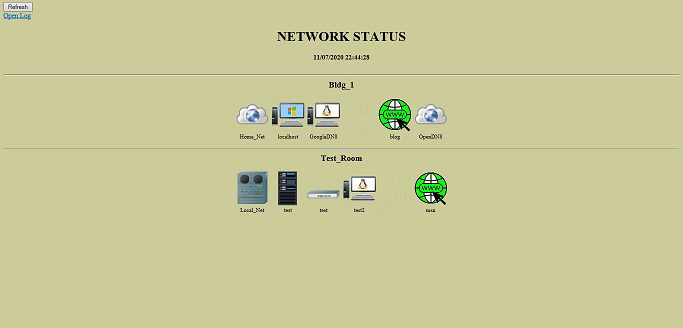
The web page starts with the basic outline and just adds the info for the systems. Then the icons can be anything just have to follow the naming convention that the script uses. The down icon is a GIF that is a flashing light. Later I added in a simple PowerShell script to play a sound that is called when something is down as the cycle ends.
The next part is the config.txt file. This file is broken down to three variables. The IP, name, and icon type. Example is below
sound
0 Bldg_1
www.ogwatermelon.com Home_Net 4
127.0.0.1 localhost 1
8.8.8.8 GoogleDNS 2
# 127.0.0.2 DNS 2
!
http://blog.ogwatermelon.com blog 9
208.67.222.222 OpenDNS 4
0 Test_Room
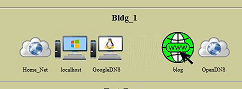
You can see the basic lay down with the IP, name, and icon number. Additionally you can change the IP to a resolvable url for an unsecured web page. This will error if there is a login required. The zero before a name will draw a divider line horizontally across the web page. If you add a name it can be used to name the section. You don’t have to use the divider either. It currently is set to place 16 icons in a horizontal row before it goes to the next line. The exclamation point is used to add a space between icons. I just wanted to be able to divide up sections so at a glance I can see if an entire area is down. This has been the case many times. There is also a default icon if you don’t place a number at the end of the config string. Otherwise you just place the number 1 thru 6 for different icon types. The number 9 is required for a web request. You can also us a number sign (#) to comment out a line. Then the script will read but skip this line but write it to the log. I put this in for machines that will be down for a long time but I didn’t want to remove from the monitor. The total number of machines you have will make a cycle longer, but a minimum I would have two systems per area. That way if one is rebooted you don’t think an entire area is down. Below is the different icons by number.
1 – Windows system
2 – Linux system
3 – Network switch
4 – Internet Cloud
5 – Router
6 – Svr stack
9 – Webpage
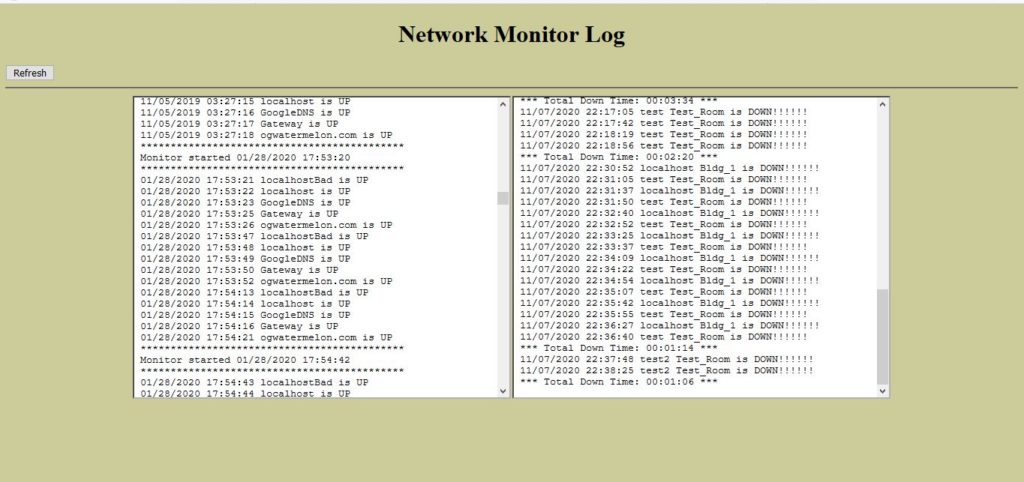
Then there is the log. I made a link on the monitor page that would open the two log files. The log on the left is every time it pings, all the machines, and a cycle. The one on the right will only show machines that have gone down until it comes back up and then the total down time. This just made it easier to see systems that went down without going through the main log that is long. It also allowed me to walk in and just look at the down log to see if I missed anything.
Lastly you could have this pushed out by a web server. I have tested this but I don’t need it to have that kind of functionality at this time. Just have the web folder located in the web server and change the location where the index.html is written. This works but I used Apache, I haven’t used IIS in years. I did look at having PowerShell create a simple web server to push out this page.
Out of all this I got a chance to work on PowerShell skills and create a product that I use everyday during an event. I will add the files to this post and please let me know what you think.

Sounds like a very useful script. Any chance of getting the files?